

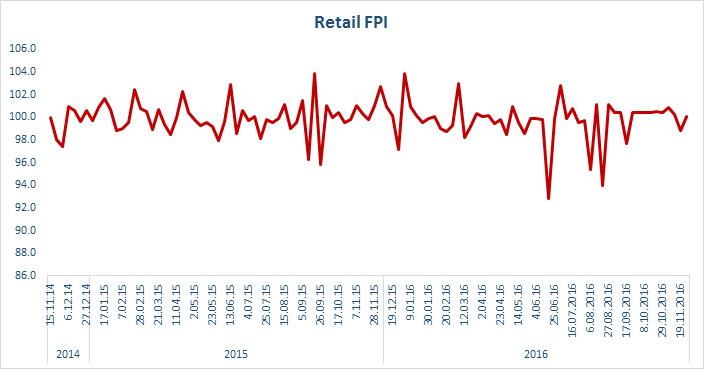
After a temporary increase at the end of October, driven by seasonal fruits and vegetables, in the last two weeks of November, ISET’s Retail Food Price Index decreased by 0.1% m/m (compared to the last week of October) and 12.1% y/y (compared to November 2015). We recorded the biggest drops for bananas (-12%), tomatoes (-12%), and beef (-7%). On the other hand, prices increased most for cabbage (10%), plums (8%), and cucumber (2%).
RETAIL FPI THROUGH TWO YEARS
ISET-PI’s Retail Food Price Index (Retail FPI) was launched in November 2014, in cooperation with Georgia’s largest retail chains, including Carrefour, Goodwill, Fresco and SPAR. While individual retailers’ data is kept confidential, average prices from all stores are combined to form a comprehensive index, as well as price indices for individual products or product categories (e.g., grocery, vegetables, dairy, etc.). The two-year dynamics of Retail FPI looks as follows (previous month=100):
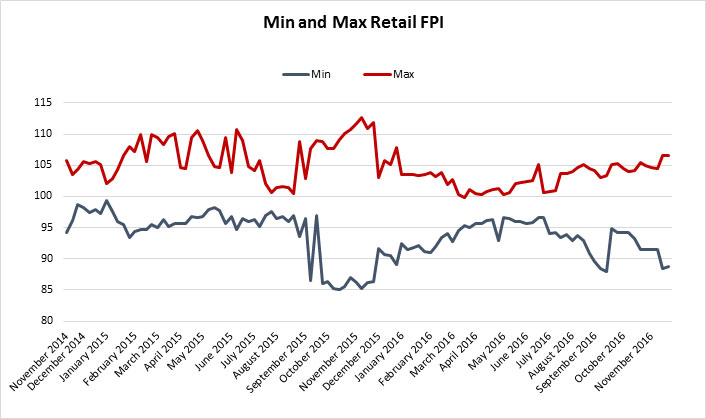
Competition among Georgian retailers is getting quite fierce. The following figure provides a comparison between the minimum and maximum prices offered by Georgia’s supermarkets. It is noticeable that there is a big divergence between minimum and maximum Retail FPI during November-December 2015. Interestingly, in November 2016, we still observe a gap between those indicators. We may expect that the difference will become even larger next month. We suspect that this divergence is due to one supermarket being able to please consumers with lower prices and promotions for upcoming holidays.
ISET FPI VS GEOSTAT FPI
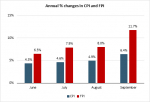
It is interesting to compare ISET’s Retail FPI to Geostat FPI. In most cases, the changes in indices coincide or only slightly differ from each other. However, for August-October 2015 and 2016, the differences between the ISET and Geostat indices are significantly large.
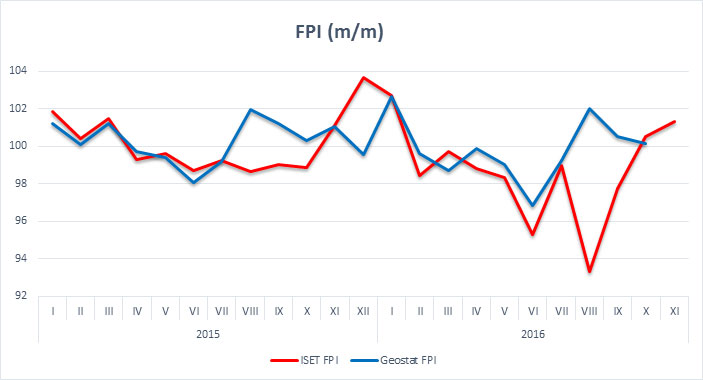
One possible explanation is that ISET FPI is comprised of 33 food products that account for 75% of food spending by an average Georgian household, while Geostat monitors the food basket that includes 92 products. It might be the case that the increase in Geostat food prices can be accounted for by the increase in prices of those goods that are observed by National Statistics Office of Georgia, but are not observed by ISET.
The second and more convincing reason for the divergence of food price indices in some cases may be the observed objects. As mentioned above, ISET FPI observes prices in the biggest supermarket chains in Georgia, while Geostat collects data not only from the biggest supermarket chains, but also from bazaar and bazaar-type objects and stores.
A very observant consumer would notice that the Geostat FPI is lower in December. The above difference in the amplitude of price reductions can be interpreted as a result of much higher price volatility in the bazaars and small stores than in the supermarket chains. This implies that the competition among the retailers in bazaars is stronger than between the supermarket chains in the food market during the holiday shopping fever season. To be more precise, small retailers are able to put out the products for sale fasterthan the supermarket chains. Accordingly, they increase the supply of food in the market and, therefore, “the invisible hand” leads prices to be more rapidly reduced in the bazaars than in the supermarket chains. In addition to this, it may be the case that the supermarket chains target different segment of consumers, and they are not concerned with the more rapid decline of the prices in the bazaars.
It turns out that Georgian consumers are faced with a difficult decision for the New Year: if Georgian consumers do not care about brands, commercials, and the pleasant environment provided by the supermarkets, they will go to the bazaars in order to buy cheaper food for holidays.
Food Price Index Recent Publications
JUNE 2021 | AGRI REVIEW
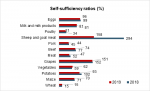
 On 15 June 2021, the National Statistics Office of Georgia published its annual publication for the agricultural sector - Agriculture of Georgia 2020. According to the publication, agriculture, forestry, and fishing comprised 8.4% of GDP in 2020, higher than the 7.2% share in 2019, but in line with the general trend over the last five years (agricultural GDP comprising on average 7-8% of GDP). Agricultural GDP in nominal terms increased by 13% on an annual basis.… Read More
MARCH 2021 | AGRI REVIEW
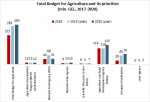
 On 29 December 2020, the parliament of Georgia approved the state budget for 2021, which includes allocations of around 18.3 billion GEL. From which the Ministry of Environmental Protection and Agriculture (MEPA) will receive 451.6 million (2.5% of the total budget allocation). MEPA will direct 10 mln. GEL towards the Environmental Protection and Agriculture Development Program (2.2% of MEPA’s total budget), with around 389.6 mln. (86.3% of MEPA’s total budget) to be allocated to agricultural… Read More
DECEMBER 2020 | AGRI REVIEW
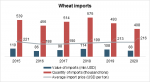 The COVID-19 pandemic raised concerns about the food security of many countries, in particular import-dependent developing countries like Georgia. Trade restrictions imposed by Georgia’s trade partners tightened the supply of some cereals and vegetables, signalling the risk of an increase in food prices. While there is no formal evidence of food insecurity due to the pandemic, given that Georgia is a net importer of wheat the state subsidized wheat imports, and, according to Georgia’s Wheat… Read More
OCTOBER 2020 | AGRI REVIEW
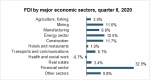 The National Statistics Office of Georgia (GeoStat) recently published its economic review for Quarter II 2020. The publication highlights that agricultural production increased by 4.7% in the second quarter of the year compared to the same period in 2019. Furthermore, agriculture contributed to 10.2% of the country’s total GDP during the same period. In the second quarter of 2020, Foreign Direct Investments (FDI) in agriculture also increased and were almost six times higher than the… Read More
JUNE 2020 | AGRI REVIEW
 On 15 June 2020, the National Statistics Office of Georgia published its annual publication for the agricultural sector - Agriculture of Georgia 2019. The publication shows that agriculture, forestry, and fishing comprised 7.2% of the nominal GDP in 2019, slightly lower than the 7.8% share in 2018, but in line with the general trend over the last five years (on average 7-8% of GDP). In nominal terms, the output of agriculture increased by 4% in 2019… Read More
DECEMBER 2019 | AGRI REVIEW
 On December 10, the parliament of Georgia approved the state budget for 2020. The budget includes allocations of around 14.4 billion GEL. Out of which, the Ministry of Environmental Protection and Agriculture (MEPA) will receive 353 mln. GEL (2.4% of the total budget allocation). MEPA will direct approximately 293 mln. GEL (2.0% of the total budget allocation) towards agricultural development and 60 mln. GEL (0.4%) will be spent on environmental protection. Compared to 2019, the… Read More
OCTOBER 2019 | AGRI REVIEW
 On 30 August 2019, a public hearing to discuss Georgia’s Rural and Agricultural Development Strategy for 2021-2027 was conducted at the Ministry of Environmental Protection and Agriculture (MEPA). The new strategy document represents a roadmap for Georgia’s rural and agricultural development for the next decade. The strategy outlines three major goals to be achieved by 2027: 1. Increasing the competitiveness of agricultural and non-agricultural sectors; 2. Sustainable management of natural resources, preservation of ecosystems, and… Read More