For many observers, the Georgian job market is a mystery. Companies are bitterly complaining about a lack of engineers, forcing them to withhold the expansion of production capacities and to cut down investments. Yet Georgian young people, who could make good fortunes by studying technical subjects, prefer to learn law, business administration and the like, qualifications that are oversupplied in the market and on average do not yield high salaries.
Young Georgians, lacking information on what sells well in the job market, apply a simple decision rule called the imitation heuristic: “If you are clueless about what to do, do what everybody else does.” If everybody studies law, then there must be something good about that subject. Legions of people cannot err.
Imitation happens all the time in economic decision making. Your friend invites you to a restaurant to which you have never been before. The menu is large and you do not know what to eat. What do you do? Well, you simply order the same dish as your friend. And maybe you have chosen that particular restaurant because it was the one that was most frequented by other people (“they cannot all be wrong!”). Imitation is also common in capital markets, where so called herd behavior, i.e. everybody buying or selling the same assets, can lead to overshooting prices, bubbles, and crashes.
There are many explanations for why people imitate each other, some of which relate to evolutionary forces that shaped behavioral patterns millions of years ago. Indeed, imitation of behavior can be frequently observed among animals, for example when a swarm of fishes changes direction in a coordinated way. It was shown that rats apply the imitation heuristic in their food selection (see, for example, “Explaining Social Learning of Food Preferences without Aversions: An evolutionary Simulation Model of Norway Rats” by Jason Noble, Peter M. Todd, and Elio Tuci, in Proceedings: Biological Sciences, Vol. 268 (2001), pp. 141-149). Recently, it was shown in a game theoretic model that imitation can be a winning strategy in many situations of social conflict (Peter Duersch, Jörg Oechssler, and Burkhard C. Schipper: "Unbeatable Imitation", Games and Economic Behavior, Vol. 76 (2012), pp. 88-96). The Georgian psychologist Dimitri Nadirashvili summarizes such findings in his book “Social-Psychological Influence” (in Georgian language, Nekeri Publishers 2009) when he writes that “95% of people are imitators” (p. 143).
THE FORBIDDEN FRUIT IS SWEET…
Imitation may be behind other behavioral patterns we observe. For example, it is only possible to imitate if one knows what others are doing, yet in many situations, this information is not disclosed. In a competitive environment, scarcity is an indicator of what other people are consuming. So one can imitate other people’s behavior by simply consuming what is scarce.
In an experiment, psychologists let people chose absolutely identical cookies either from a vase with lots of cookies or from a vase with just few cookies. The experimental subjects consistently favored the latter, and this effect was even stronger when “popularity” was mentioned as the reason for scarcity (Stephen Worchel, Jerry Lee, and Akanbi Adwole: “Effect of Supply and Demand on Rating of Object Value”, Journal of Personality and Social Psychology, Vol. 32 (1975), pp. 906-914).
Marketing specialists knew all along that the forbidden fruit is sweet. Therefore, we see many advertisements emphasizing the limitedness of a good. The obsession of humans with gold, a metal that is pretty useless for most practical purposes, may originate from this deep-rooted desire for scarce things. Standard microeconomic theory, on the other hand, takes the valuation of an economic good as exogenously given, independent of the availability of the good.
… AND IF YOU FAILED TO GET IT, IT WAS A SOUR GRAPE
What about people who succeeded to acquire a scarce item? They paid more just because it was scarce, not because the good yields higher utility. Will they not be frustrated once they find out that they bought something that is popular but does not yield a value justifying the high price?
Chances are that they won’t. As it turned out, people overvalue an item for which they paid too much. Likewise, they tend to tend to derogate things they did not get, a psychological mechanism commonly referred to as the “Sour Grape Phenomenon”. It can be explained by the famous cognitive dissonance paradigm of the American psychologist Leon Festinger (1919-1989). Festinger postulated that people seek harmony between their beliefs and their behavior and when there is a discrepancy (a “cognitive dissonance”), they will change one of the two. The overpriced scarce good is bought and cannot be returned, so even if objectively it is plainly disappointing, the behavior cannot be undone. Yet the belief about the quality of the item is flexible. It is possible to autosuggest that something is great, even if objectively it is just mediocre.
Those who did not manage to obtain the limited item will feel a cognitive dissonance, too. Though initially they considered the object really desirable, they have to cope with the fact that they did not get it. Instead of admitting to themselves that they are failures, they will find it easier to just change their opinions about the value of the good.
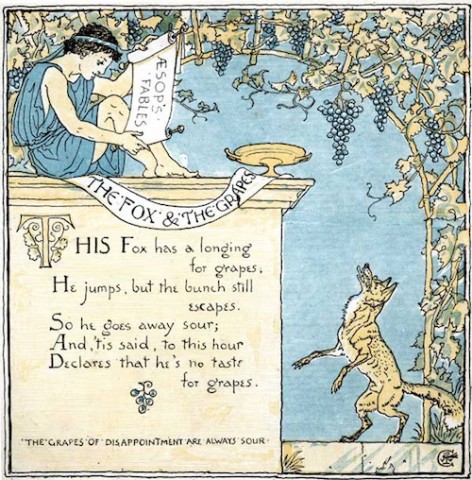
The name “Sour Grape Phenomenon” comes from one of Aesop’s fables, beautifully put into rhymes by W.J. Linton in 1887:
“This Fox has a longing for grapes:
He jumps, but the bunch still escapes.
So he goes away sour;
And, 'tis said, to this hour
Declares that he's no taste for grapes. “
The graph shows how the “forbidden fruit” and “sour grape” effects might affect the standard economic diagram of supply and demand. The dotted line is the new demand curve that comes about once psychology has kicked in. In line with intuition, the psychological effects create a price range where demand increases when the price goes up.
Let us try to overcome these irrational desires. And let the upcoming New Year sales be the first test for our rational minds!


Comments
Have you read Thinking Fast and Slow?
Interesting, especially the visualization. The argument has been round for quite some time now, however, what I have not thought about is the actual effect on the demand curve. Two things troubling in that respect: (i) the fact that in this case the shape of demand curve is not independent of supply (ii) you end up with multiple (in fact infinite) equilibria.
A great post, but the visualization is confusing.
The "forbidden fruit" situation is better described by a perfectly inelastic (vertical) supply curve. In this case, there would only one equilibrium. People who are initially willing to pay an epsilon more (and hence move faster) get the good in question, say, a Lamborghini car (of which only a small quantity is produced every year). Others have to wait at least a year. Those who get the car (the lucky winners) would only sell for twice the price they paid (their demand curve shifts upward). The losers would all of a sudden discover that they have better things to do with their money and feel happy they lost (their demand curve shifts down).
This situation is beautifully analyzed and described in Dan Ariely's book Consistently Irrational, which I am reading right now. His ran experiments with Duke university students who were bidding to buy tickets for the final four college basketball game in the US (which were in strictly limited supply).
One should not take the graph too seriously. It is obviously not a scientific article and not a scientifc diagram. Our diagram is one possibility (not the only one) to capture the two effects. There is nothing wrong with infinitely many equilibria; I do not think that this is less plausible than a demand curve with a vertical part.
Dear all, thanks for your valuable comments. As Florian says, it is not a scientific article but anyway for better illustrating the point we were trying to convey, I have opted for replacing the chart (that I have put together in a confusing way). I hope now it better illuminates the point. Thanks Zak and Eric, for pointing that out. The simple idea to convey is that the discrepancy between the valuations of a marginal buyer and a marginal loser is high, even if their initial valuations of the good were almost the same.
After pondering about it a bit deeper, it looks to me as if the diagram is quite silly -- both in the original and in the modified version. When the price goes down, the supply and hence the availability of the good decreases. Therefore, the "forbidden fruit" effect kicks in and for a given price, the demand curve shifts to the right. In the diagram, however, it shifts to the left for low prices. When the price goes up, the supply of the good increases, and the "forbidden fruit" effect disappears. Hence, in that case the demand curve should shift to the left (relative to lower prices). In the diagram, for high prices it shifts to the right.
The "sour grape effect", however, cannot be displayed in this diagram, because it just sets in when people have already bought the good. The demand curve depicts the ex ante willingness to pay for a marginal unit of the good, not the ex post willingness to pay. The curve describes the situation before the good was actually bought, and hence cannot capture the sour grape effect.
When I looked at the diagram for the first time, I had an intuition that the two effects can indeed lead to a price range where demand goes up in the price, and so I did not dig further. My intuition was like: Good gets scarce ==> prices goes up ==> demand increases if the "forbidden fruit effect" outweighs the price effect. However, I think that this argument cannot be displayed in this diagram.
Anyway, thanks to Eric and Zak for pointing out their correct concerns about the diagram. Unfortunately, scrutiny suffers when one is doing things under time pressure. My apology.
Nino, would be better to drive the vertical dotted line through the point at which the original demand and supply curves cross each other. This would reflect the fact that the quantity exchanged is the same equilibrium quantity, however those who managed to purchase are now not willing to part with the good for the price at which they bought it (and vice versa, those who did not buy the good at first try, are no longer interested in buying at the equilibrium price). Not sure this makes it fully scientific, but...
Is this ( new chart ) what you meant?