

")


How much foreign wealth does a country really have? In the Balance of Payments Accounts, the net foreign wealth is essentially the difference between the assets held by the country’s residents abroad and the country’s liabilities to foreigners, valued at the market price in each given year. If this number is negative, then the country is a debtor to the rest of the world, and needs to generate enough surplus output in the future to pay back foreign investors.
The change in net foreign wealth in any given year reflects the extent of country’s borrowing or lending and provides information to foreign investors about the state of country’s finances. If net foreign wealth is sufficiently large and negative, this may catalyze a run on the country’s assets – a financial crisis.
Certainly, there has been no shortage of financial catastrophes in the last few decades. One prominent example was the Latin American debt crisis in the 1980s, when the large economies, Brazil, Argentina, Mexico accumulated significant external debt amounting to about 50% of the GDP of the entire region. The crisis that followed was fueled by the investors’ lack of confidence in the countries’ ability to repay their growing foreign debt, given their economic growth prospects and the costs associated with servicing the debt.
The recent European debt turmoil reminded us once again, that while there is no magic number after which the debt/GDP ratio becomes unsustainable, it is still important to keep the ratio in check.
In the last few years, even before the 2008 sub-prime crisis, the growing external debt levels of the United States came under close scrutiny. The US was the largest debtor in the world, and the stock of debt was growing fast. Yet, despite the doomsday scenarios, the predicted big crash did not materialize. Not even in the 2008-2009, when the US economy was clearly in the midst of the “Great Recession”.
Several factors may account for such an outcome but one of the most surprising answers came from the 2005 article by Hausmann and Sturzenegger. In the article the authors make a claim that instead of being a net borrower, the US is actually a net creditor to the rest of the world.
How can this be? The authors point out that US, despite being officially in debt, still manages to receive positive net interest payments each year from the rest of the world. Clearly, this is a paradox, since it is hard to imagine a borrower who rather than paying for the privilege of borrowing is instead being paid.
The authors argue that the explanation must lie in the “missing” or “mismeasured” wealth, the so-called “dark matter”.
According to the “dark matter” argument, if the “book value” of two assets is the same, but one of the assets has a relatively higher return, this asset must have a de facto higher value.
Thus, the return-based valuation, like a fairy godmother, transforms our debtor-Cinderella into a creditor-Princess. If you happen to believe in fairy godmothers – a happy ending for the United States indeed.
But how about other countries? How about Georgia?
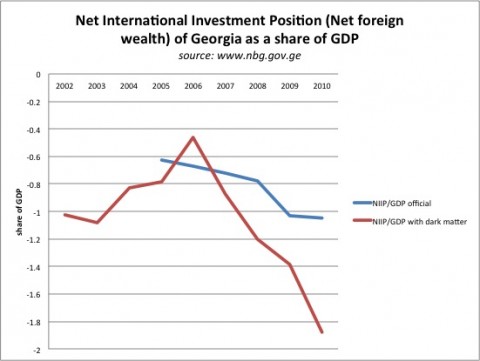
Currently Georgia’s net foreign debt/GDP ratio stands at about 1.05. The “dark matter” calculations show, that assuming Georgia pays about 3% on its foreign liabilities and receives about 1.5% return on its foreign assets, the debt/GDP ration would be much higher, around 1.87
Moreover, as shown on the graph above, the net international investment position of Georgia calculated using the return-based valuation has deteriorated much faster since 2006, then the official Balance of Payments would suggest.
The main question is – are things really so much worse than we think, and should we treat these numbers as a warning? The answer depends on whether you believe in the “dark matter” and the underlying assumptions. More importantly, whether the markets actually take the “dark matter” into account when evaluating the state of the country’s finances.


Comments
Interesting (as Hausman's other other innovative techniques) and alarming! Can you please explain where did 3% and 1.5% (that you used for your calculations) came from? I guess they are averages over some time, but I am wondering what is the time span.
Another interesting thing is what happened in 2006 that made dark matter to acquire negative mass, and why did that same year marked the reversal in the trend.
It was Confucius who said that the hardest thing of all is to find a black cat in a dark room, especially if there is no cat. To make sure that the black cat exists it would be great to get more detail about these two numbers (1.5% and 3%) and how they enter the "dark matter" formula. Once we better understand the calculation, it would be indeed very interesting to discuss what happened after 2006.
Eric, Zak, great to see you back in action with tough questions
I have not yet tried to understand the reasons behind the rise and fall of the Dark Matter. But I will certainly look into it more closely. But for now a little note of explanation:
The data comes from the National Bank of Georgia
http://www.nbg.gov.ge/index.php?m=353&lng=eng
The formula used by Hausmann and Sturzenegger is the following:
The underlying value of an asset * interest rate = earnings
Value = earnings/interest rate
The net international investment position with dark matter is then calculated as follows:
NIIP dark matter = {Value of assets owned by the country – Value of assets owned by foreigners} = [Investment income from assets owned by the country/rate of return on these assets] – [investment income paid to foreigners/interest rate paid on these assets]
The interest rates are ballpark estimates in both cases. According to the official data Georgia pays an average rate of 2 plus percent on its liabilities. I rounded my guess to 3 percent.
The 1.5% return on asset is once again a plausible guess. (That’s about the interest rate paid on the 10-year municipal bonds of the United States). One can certainly dig around a little more to come up with better estimates.
I am attaching the data below in case you would like to do the calculations yourself.
year Investment income mln USD (debits) Investment income mln USD (credits) Net investment income mln USD NIIP official mln USD
2002 -122.5 9 -113.5
2003 -148.3 9.4 -138.9
2004 -158.3 15.4 -142.9
2005 -183.3 16.1 -167.2 -4023.5
2006 -159.5 25.9 -133.6 -5178.6
2007 -419.4 76.9 -342.5 -7327.2
2008 -611 75.1 -535.9 -9942.6
2009 -510.7 31.3 -479.4 -11088.1
2010 -727.6 35.2 -692.4 -12224.7
Interesting. And a very good and simple explanation of the HS article. As always, it is a pleasure reading the ISET blog.
On the other side, it seems that Georgia could easily improve her NIIP dark matter by investing into riskier, high return assets - say Greek government bonds. That would immediately improve the NIIP dark matter, but it would arguably not measure what Hausmann/Sturzenegger had in mind.
Right, in all probability HS did not intend to promote the equivalent of Greek government bonds!
One of the points made in the paper is that the net investment income flows into the United States seem to be quite stable over time (despite the arguably higher risk attached to the high return foreign asset holdings).
The US it seems has managed so far to have its cake and eat it too.... The same thing would not necessarily be true for countries like Georgia.
I keep most of my financial assets in a Georgian bank at almost 10% interest, which is about 7 times higher than what I would earn on 10-year US municipal bonds. Given this ratio, my foreign wealth including "black matter" is sufficient to allow me to retire sooner than I thought. Am I missing something?
not sure about retiring early :-) Clearly Georgian bonds are percieved to be more risky than US bonds. However, if on average your risky foreign wealth portfolio offers a stable return (like in appears to be in the US case), then you might be able to borrow more money against your "dark matter adjusted" wealth than you would otherwise.