- Details
In January 2018, the average price of cooking one Imeretian khachapuri stood at 3.71 GEL. Compared to the previous year (January 2017), the Khachapuri Index gained 1.3 %. While going up in yearly terms, the Index actually dropped 2.9% compared to the previous month (December 2017).
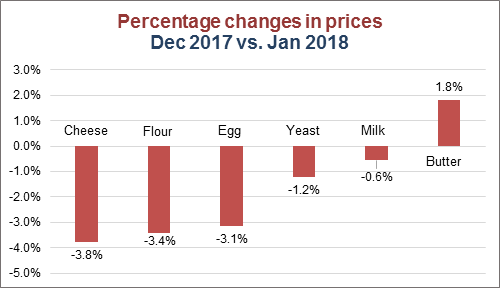
As shown in the chart, all khachapuri ingredients except butter contributed to the Khachapuri Index monthly deflation. The price of only one ingredient – butter - increased by 1.8% compared to previous month. All other khachapuri ingredients decreased in price: cheese (3.8%), flour (3.4%), egg (3.1%), yeast (1.2%) and milk (0.6%).
- Details
In January 2018, the average cost of cooking one standard Imeretian Khachapuri dropped to 3.71 GEL, which is 2.9% lower month-on-month (compared to December 2017), and 1.3% higher year-on-year (compared to January 2017).
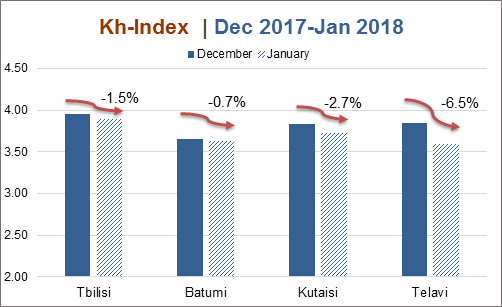
In monthly terms, the Khachapuri Index is going down in all Georgian cities. Telavi is experiencing the biggest drop in the Index (of 6.5%), at 3.60 GEL, and appears to be the cheapest city. Tbilisi is (and has been for the past three months) the most expensive city in Georgia for khachapuri lovers. The price difference between the most expensive (Tbilisi) and the cheapest (Telavi) cities was 0.29 GEL.
- Details
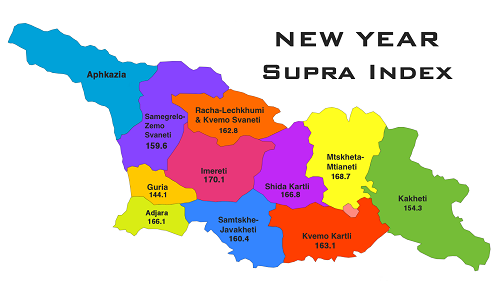
ISET-PI likes to keep tradition and cook up a New Year’s Supra Index for our readers. The Index shows the cost of a standard festive supra meal for a family of five to six people in each region of Georgia. Traditional dishes included in our calculations are: mtsvadi, satsivi (chicken in walnut sauce), khachapuri, trout, tabaka (fried) chicken, olivie salad, pkhali, cucumber&tomato salad, and for desert, fruit and gozinaki (caramelized walnuts fried in honey).
The average cost of this New Year’s supra in Georgia is 161.60GEL in December 2017, which is 8.1% higher compared to same period last year (December 2016).
- Details
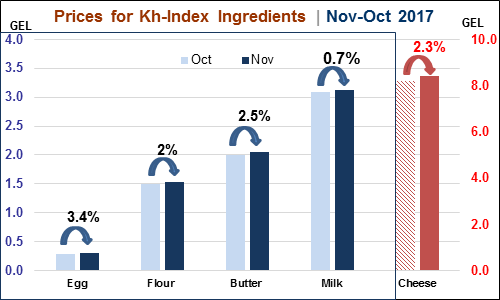
The Khachapuri Index continued its upward trend in November 2017, with the average cost of cooking one standard Imeretian Khachapuri reaching 3.70 GEL. This is 1.8% higher month-on-month (compared to October 2017), and 7.1% higher year-on-year (compared to November 2016). In general, the increasing trend at this time of the year is driven by the seasonal decline in the supply of fresh milk, and excess demand before the start of the fasting period. This leads to a corresponding increase in cheese and other milk product prices.

