In a recent ISET blog post, Luc Leruth explores the notion of a spatial fracture in Georgia. He wonders whether people will become accustomed to working remotely, with the COVID crisis having given them this fresh opportunity. If so, this could help decrease the strain on Tbilisi infrastructure by slowing down migration to the capital. Will COVID, unexpectedly, convince people to continue working remotely and settle outside Tbilisi in the countryside? Or are regional disparities such that this is unrealistic? To look more closely into the matter, this blog reviews a few regional indicators to assess livability and general quality of life across Georgia’s regions.
As discussed in our previous blogs, the Tbilisi population has been steadily rising since 2014, though it’s important to question what has been happening in other regions? According to Geostat’s regional data, it seems that the population has been steadily declining in every region expect Adjara, Kvemo Kartli, and Mtskheta-Mtianeti. However, as the data highlights, even in these areas, this trend is essentially due to increased population in urban areas, as in Batumi, Rustavi, and Mtskheta.
Rapid urbanization in developing countries is now quite common; unsurprising as people tend to move towards areas with greater economic opportunities and higher living standards. These trends pose a particular problem for policy-makers: besides placing undue strain on urban infrastructure, rapid urbanization also increases emissions, imperils the environment, multiplies socio-economic problems, and makes cities less sustainable. As such, finding solutions to the problem of a “shrinking countryside” would allow Georgia and similar countries to progress towards the goals set out in the 2030 Agenda for Sustainable Development and those outlined in ambitious research and innovation programs, such as Horizon Europe (2021-2027). Firstly, however, policy-makers need to understand the drivers behind such trends: What makes people want to move? How regional development outside large urban centers can be incentivized? And lastly, whether, and how, COVID-19 will affect current urbanization trends? Consequently, Georgia can offer an interesting case study for researchers in Europe and elsewhere.
Tbilisi has the highest GDP per capita, with other regions lagging behind to various degrees, and the capital also has the most diversified economy. A 2013 study on regional disparities in Georgia (Fuenfzig, 2013), pointed out that existing income disparities across Georgian regions can largely be explained by urbanization rates: incomes tend to be higher in more urbanized and densely populated regions. Nevertheless, the same study also argues that variability of household incomes within any given region is far higher than the income variability across regions. This essentially means that inequality in Georgia is spread out, and poverty does not seem to be concentrated in particular regions or groups of regions. These results are echoed in another study on income inequality in Georgia compiled by Beenstock, Babych, et al. in 2016. Their research noted that Georgian regions are fairly homogeneous in terms of income distribution and inequality between-regions is very low; with ninety-four percent of total inequality explained by inequality within regions. Moreover, the study (using data until 2014) found that income disparity between urban and rural areas was not at all high. In fact, after cost-of-living adjustments, Tbilisi became one of the “poorest” areas in the country, consequently, one may assume, a less attractive place to live.
Given these findings, we come across something puzzling: why do we observe a movement of people from rural to urban areas, more specifically from the periphery into Tbilisi? (as previously discussed, this mobility trend was not seen in the data prior to 2014 but has become quite pronounced since that stage). It may be that the urban-rural income divide has grown, making cities, especially Tbilisi, more attractive to rural dwellers. There is, however, another possible explanation: perhaps we are failing to properly consider one crucial aspect which influences mobility decisions – the disparity in amenities and quality of life in urban vs. rural areas and in the capital city vs. the periphery. Now that COVID has given people a chance to test remote working, will these amenities be sufficient to convince them to remain outside the capital?
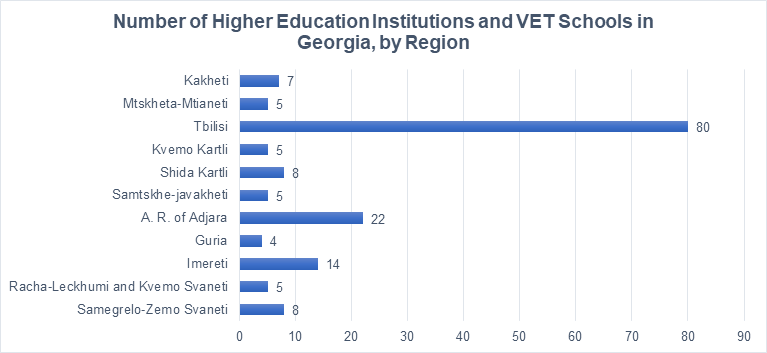
Just how stark is the amenities gap between Tbilisi and the rest of Georgia? First, let’s consider some recent (2019-2020) indicators of “soft infrastructure” – e.g., the number of higher education institutions and VET schools in each region – to assess the opportunities offered to students who have completed basic education. As seen in Graph 1, Tbilisi has 80 higher education institutions and VET schools, while, for example, Guria has only four; A.R. of Adjara has 22, the majority of which are located in Batumi; while the third highest is from Imereti, with Kutaisi taking the lead.
Graph 1. Number of higher education institutions and VET schools in Georgia, by region
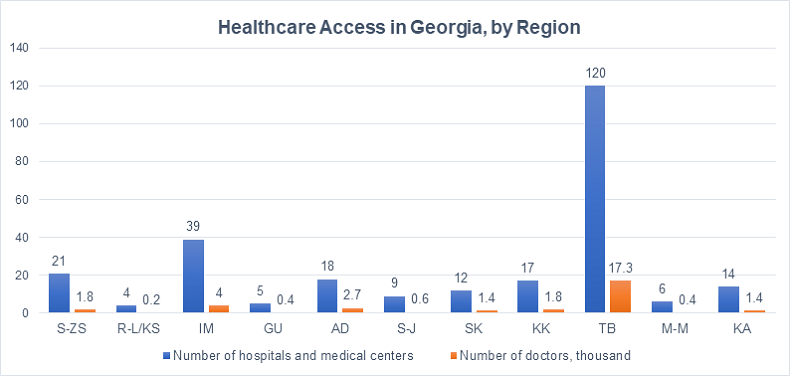
Access to health facilities is another critical factor when deciding to settle in a certain area. What then are the differences in healthcare services across regions? Based on Graph 2, one can see there is a significant difference between the capital and the rest of Georgia. There are 120 hospitals and medical centers in Tbilisi, with 17.3 thousand doctors, while in the region of Racha-Lechkhumi and Kvemo Svaneti there are only four, with 0.2 thousand doctors.1
Graph 2. Healthcare access in Georgia, by region
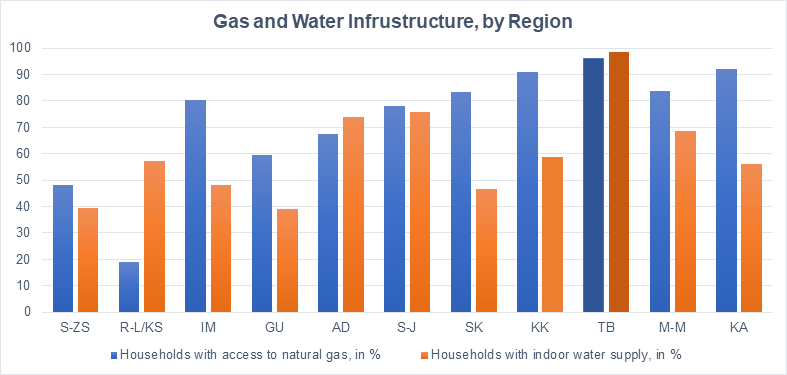
Considering the differences in physical infrastructure, Graph 3 shows two indicators from each region – the percentage of households with access to natural gas and those with an indoor water supply. Tbilisi is almost fully covered – with 96.2% and 98.7%, respectively – although the regions lag behind by various degrees. Notably, even regions closer to Tbilisi with physical infrastructure are still losing population.2
Graph 3. Gas and water infrastructure, by region
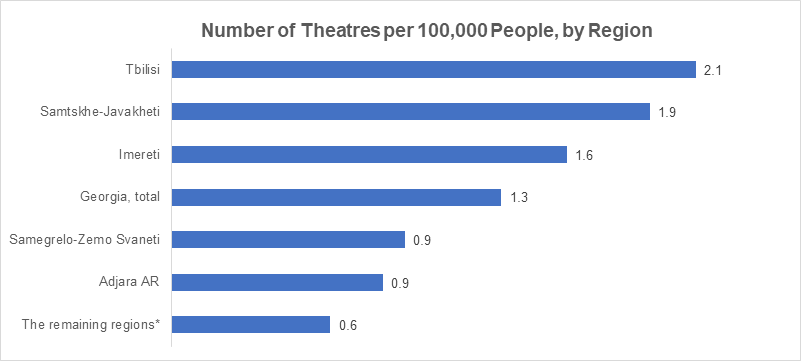
Last but not least, another significant driving factor could be the cultural events and social opportunities a city offers. To assess the difference in cultural activities we have compared the number of theaters per 100,000 people among each region. Tbilisi takes the lead with 2.1 theaters per 100,000 people, with Samtskhe-Javakheti second with 1.9, followed by Imereti with 1.6.
Graph 4. Number of theatres per 100,000 people, by region
To summarize, economic opportunities do play a role in people’s decisions to settle in a particular area, but access to cultural and educational opportunities, healthcare services, and other, less tangible aspects of livability, can create as many, sometimes more, incentives for people to leave their homes and settle in more “livable” areas like Tbilisi.
The four indicators described form just a small part of the complex concept of livability. Yet, even from this limited example, differences in amenities between Tbilisi and the rest of Georgia appear high enough to expect a continuation of the current population movement trends, despite the incentives to the contrary provided by COVID. It is also worth noting that disparities within a region’s rural and urban areas are likely still high, and certain smaller Georgian cities may well become attractive economic focal points, given the right incentives. What exactly those incentives could be is one of many questions that would prove excellent further research into the future of sustainable development in Georgia.
[1] After Tbilisi comes Imereti with 39 entities with 4k doctors. Adjara has forth highest number of hospitals and medical centers at 18 and the third highest, 2.7k, number of doctors.
[2] Kakheti has the second highest percentage of households with access to natural gas with 92.2%, for households with indoor water supply comes Samtskhe-Javakheti with 75.7%. Adjara has the third highest share of households with an indoor water supply (74.1%), but availability of natural gas is not as high (67.6%).


Comments