Looking at the consumption and generation trends of the past year, it is evident that Georgia is an electricity importing country during most months, with consumption almost always exceeding domestic generation. The only exceptions over the last 12 months were May and June, when the generation-consumption gap briefly became positive, reverting to the negative again in July. This is quite a dramatic change from how the country’s generation-consumption gap looked back in 2010, when the country exported almost seven times more electricity (1524.3 GWh) than it imported (222.1 GWh) and thermal power generation was reduced to 682.8 GWh. In 2010, hydropower generation (9374.9 GWh) made up 111% of domestic consumption (8441.1 GWh) and there was a feeling that Georgia was on the right path to remaining a self-sufficient and electricity exporting country. Things started to change in 2011, when the country was hit by a “dry year” while consumption kept growing. Over time, other factors (such as relatively low electricity tariffs and the country’s fast economic growth) kept pushing demand up while internal generation capacity (particularly hydropower) failed to keep up.
How big is the gap between generation and consumption now? As shown in Figure 1, in February 2020 the gap widened to 273 mln. kWh (32% of total generation and 24% of total consumption). The negative generation-consumption gap has increased by 70% compared to January 2020 and more than doubled compared to one year before. The widening of the negative generation-consumption gap in February 2020 is the result of decreased power generation (down by 9% compared to February 2019) combined with increased consumption (up by 8% with respect to February 2019). Compared to January 2020, generation and consumption have both decreased, however the decrease in power generation exceeded the decrease in electricity consumption by 12%.
Figure 1. Electricity Generation-Consumption Gap
This outcome looks even more worrisome and puzzling if we consider that from February 2019 nine hydropower plants (HPPs)1 and one thermal power plant (TPP) with 2% and 5% respectively of the total installed capacity have joined the electricity generation market. Therefore, a decline in power generation took place despite an increase in the installed generation capacity.
In order to identify the reasons behind the increase in the negative generation-consumption gap, it is therefore necessary to analyze the decrease in power generation. What was the reason for it? Should we also expect the negative gap to persist over the following months?
The Georgian electricity market depends on power generated from different sources including hydro, wind, and thermal. The most significant share of total electricity is generated by hydropower plants. Over the last thirteen years (2007-2019) HPPs provided 84-100% of total generation during the summer period (May-August), while in the other months their share declined, remaining above 50% of total generation. From 2007-2019 in only two instances did TPPs account for more than 50% of total generation: March 2012 and February 2017. This happened again in January of this year. In February 2020, the electricity generated by TPPs was 47% of total generation, very close to half, while HPPs generated 52%, (Figure 2).
Figure 2. Electricity Generation by Sources
Given the significance of hydropower generation in the Georgian context, we decided to focus on the factors that affect it.
The first factor that comes to mind is the evolution of precipitation rates, which is reflected in potential hydropower generation. Based on the National Environment Agency (NEA) data, average precipitation in 2019-20202 was the lowest since 2007-2008, and down by 12% compared to the same period in 2018-2019 (Figure 3). This trend in precipitation rates is, therefore, consistent with the decreased HPP generation potential during the past twelve months and the past years, reflected in the trend of the widening negative generation-consumption gap.
Looking at other data, the average water level in the Enguri HPP reservoir (the largest in the country) decreased by 4% in February 2020 compared to the previous month (from 452 to 433 meters). Another factor that might explain the recent drop in generation from HPPs is the need to perform rehabilitation works. Decreased generation of two major HPPs indeed accounts for most of the negative generation-consumption gap, since the share of total electricity produced by the Enguri and Vardnili HPPs was 17% in February 2020 (the second lowest after 13% in February 20173).
Figure 3. Annual Precipitation Rates
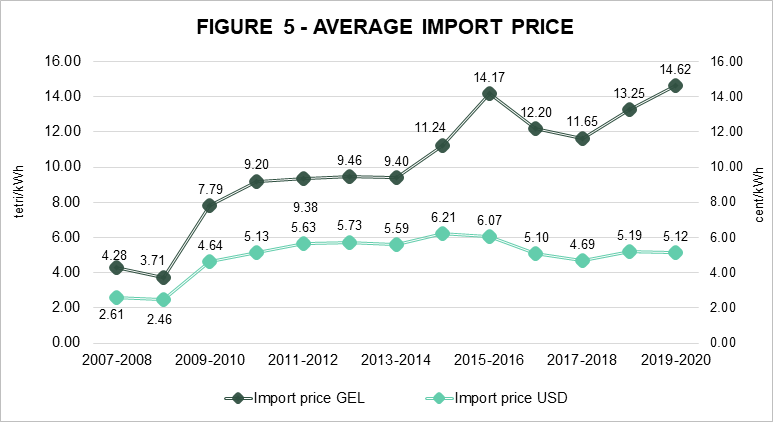
Over the past twelve months, the negative generation-consumption gap was filled by increasing the amount of imported electricity from Azerbaijan and/or Russia. In February 2020, Georgia imported 312 mln. kWh of electricity (Figure 4). In addition to the increased imports of electricity, during the past year a significant share of electricity was produced by thermal power plants. Since TPPs require imported natural gas as a main input – gas which is imported from the same partner countries (Azerbaijan and/or Russia) – the energy security issue for the country is even more severe than demonstrated by the negative generation-consumption gap. The concentration of foreign energy supply sources is not the only reason for concern, though. With increased electricity import (Figure 5) and gas prices (now fixed to $143 per thousand cubic meters of gas) due mostly to exchange rate fluctuations, satisfying local demand either by foreign electricity or gas is becoming more expensive as time passes.
Figure 4. Electricity Import and Import Price Over The Past Year
Figure 5. Average Import Price4
WHAT COULD OR SHOULD BE DONE?
As far back as 2013, when the first signs of a potentially widening negative generation-consumption gap appeared, ISET-PI discussed several potential options policymakers might have considered.
At that time, we argued that there was a need for:
- Attracting investments for new generation capacity, diversifying away from hydropower, because “being dependent on rainy seasons is not an ideal situation”;
- Making sure the Enguri and Vardnili Hydropower Plants fully recovered their generation capacity;
- Promoting energy efficiency programs and making sure electricity tariffs reflected the true cost of generating electricity
Seven years later, it looks like there is still a lot to do in all these directions.
HPPs still dominate the current power generation structure, as well as future projects. According to the future investment project list5, 63% of the new total installed capacity (6038 MW) will be provided by HPPs, while wind power will deliver an additional 20% and, thermal and solar power plants (SPPs) will account for 9% each. Since lower precipitation rates and increased temperatures are expected to create unfavorable conditions for hydropower generation, in our opinion, supply-side policies should encourage further diversification of power generation sources by promoting non-hydro renewable energy projects while pursuing the quick and full recovery of the generation capacity of Enguri.
Some space also exists for better demand-management policies, with more emphasis on promoting energy efficiency. It is possible that the upcoming liberalization of the electricity market will help in this respect if electricity prices more closely reflect the real cost of electricity.
In the meantime, the Georgian power system remains vulnerable to sudden fluctuations in the availability of electricity at affordable prices. We should expect a very tight market in 2021, when the Enguri HPP will be closed due to diversion tunnel rehabilitation works (which are supposed to start in February 2021 and last for approximately four months). However, this will hopefully help bring Enguri closer to its true generation potential, which will help in the longer term.
In conclusion, while we cannot precisely predict for how long the negative-generation consumption gap will persist, we remain positive that a lot can be done to reverse this trend and strengthen the country’s energy security.
1 Two seasonal (Mestiachalahesi 1 and 2) and seven small HPPs (Oro hesi, Avanihesi, Sashualahesi 2, Chapala hesi, Khelra hesi, Ipari hesi, Dzama hesi).
2 Starting from March of the previous year and ending in the following February. For example, 2019-2020 indicates the precipitation rate from March 2019 to February 2020.
3 According to the Ministry of Energy, Enguri stopped generation for approximately 2 weeks due to the planning of rehabilitation works.
4 Starting from March of the previous year and ending in the following February. For example, 2019-2020 indicates average import price from March 2019 to February 2020.
5 Source: Ministry of Energy.


Comments