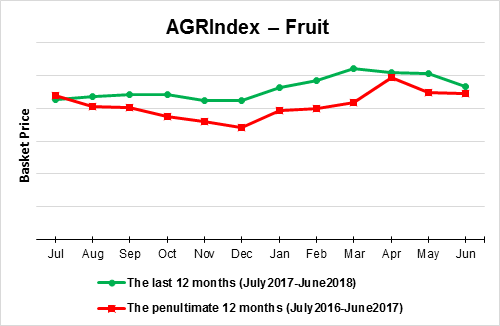
In June 2018, FRUIT prices continued their recent declining trend — the m/m change last month ...
Read more


ISET-PI has begun publication of a new product – the Budget Execution Monitor (BEM). The goal of the BEM is to forecast revenues and expenditures of the general government of Georgia for the cu...
Read more

In recent months, ISET‐PI has devoted considerable time to exploring the reasons behind the sharp decline in annual real GDP growth in 2013 (from 6.2% in 2012 to 3.3%). With official data for the whole of 2013 finally becoming available, we are taking this opportunity to revisit our previous conclusions and offer new insights.
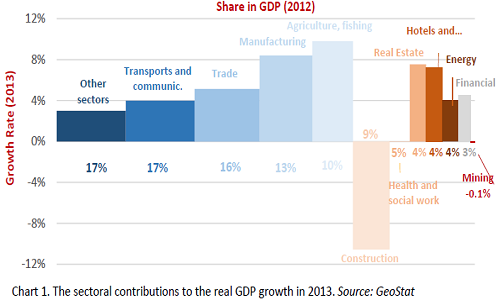
The figure below provides a visual representation of the sectoral contributions to the real GDP growth in 2013. The horizontal axis represents the share of each sector in total GDP in 2012, whereas the vertical axis represents growth rates of each sector in 2013. Thus, the area of each rectangular block represents the overall contribution of each sector to real economic growth in 2013 (Under other sectors we included Education; R&D; other community, social and personal service activities) Download the full report